


Spectroscopy Observing Program Coordinator:Steve Boerner
2017 Lake Clay Drive
Chesterfield, MO 63017
(636) 537-2495
|
Introduction
| By the end of 5th grade school children know when light passes through a prism it is broken into its component colors ranging from red to violet. Many of us are excited when we see a rainbow’s colors of ROYGBV. In 1802, the English chemist William Hyde Wollaston was the first person to note the appearance of a number of dark features in the solar spectrum. In 1814, Joseph von Fraunhofer independently rediscovered the lines and began a systematic study and careful measurement of the wavelengths of these features. Today we recognize that the colors and lines are part of an area of knowledge known as spectroscopy, the branch of science concerned with the investigation and measurement of spectra produced when matter interacts with or emits electromagnetic radiation. Spectroscopy makes use of an instrument called a spectrograph to produce the colors (spectra). A spectrum can be analyzed to produce a spectrogram, a visual representation of the spectrum of frequencies as they vary in intensity.
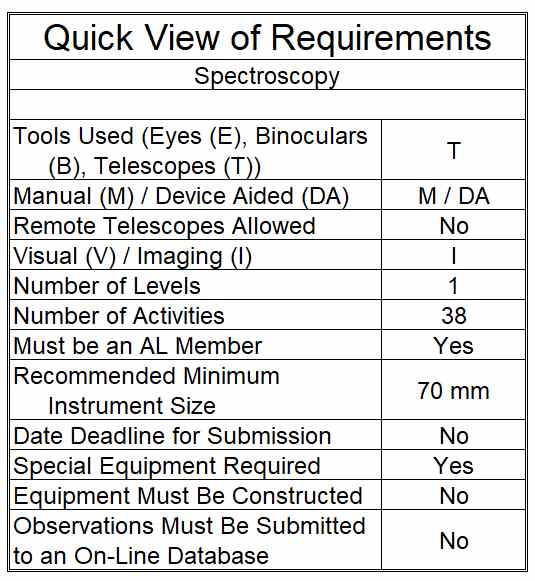
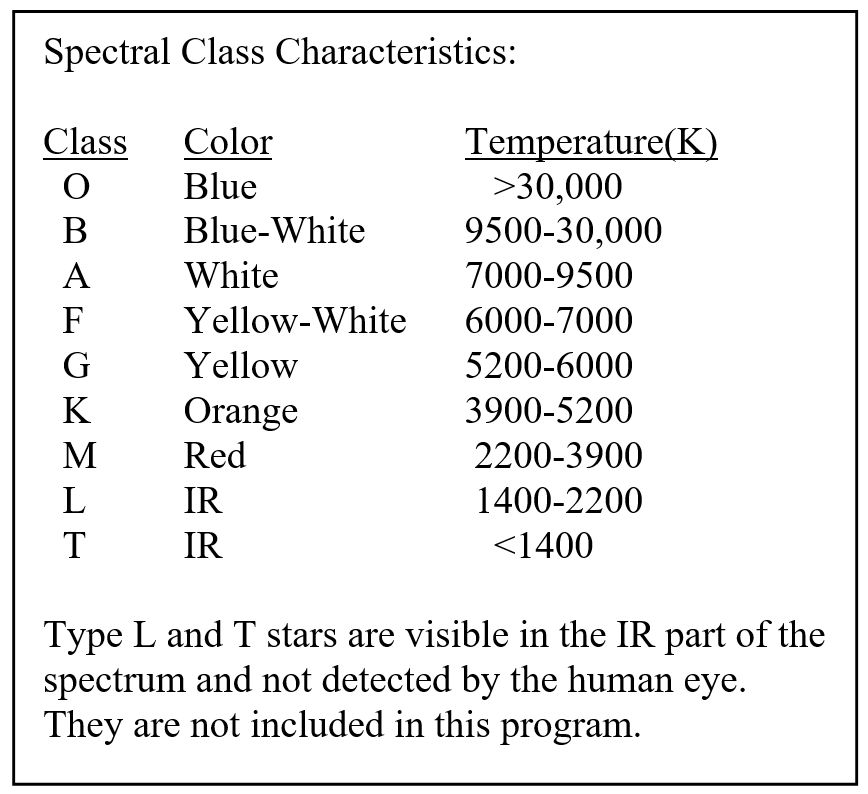
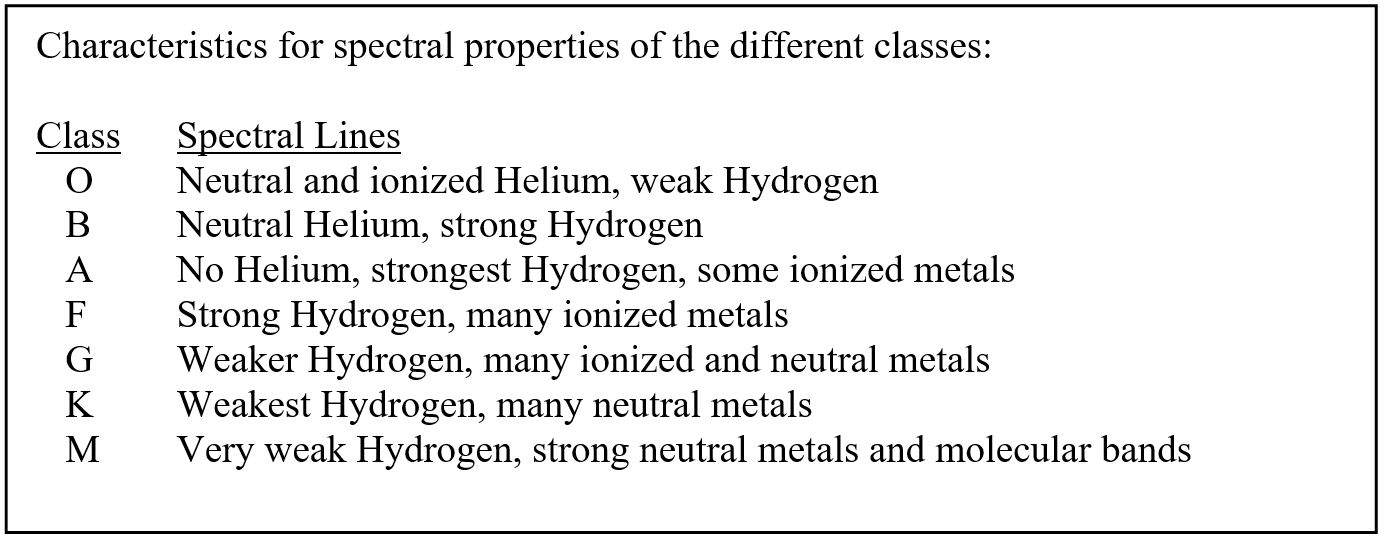
Most of what we know in astronomy is a result of spectroscopy: It can reveal the temperature, spectral class, and composition of an object as well as be used to infer mass, distance, luminosity, relative motion using Doppler shift and many other pieces of information. Spectroscopy is done at all wavelengths of the electromagnetic spectrum, from radio waves to gamma rays, but this program will focus on visible light. The radio frequencies are addressed in the Astronomical Leagues’ Radio Astronomy Observing Program. Through the work of Indian astronomer Meghnad Saha and others, it was realized that a primary difference between stars was their temperature, and so the classification scheme was organized into “OBAFGKM” based on temperature, from the hot O stars that cause most of the surface Hydrogen to be ionized to the cool M stars that are unable to excite Hydrogen’s electrons at all. Thus, we see different features for different classes of stars as shown in the tables below: Each Observing Program has unique requirements. After reading this web page, and reviewing the Quick View of Requirements grid, if you have any questions about your equipment or how you plan to do your observations, please contact the Coordinator before you start observing. |
* – The number of observations will vary depending on which projects you choose.
|
The Certification:
- The recording of astronomical spectra requires imaging and as such visual observation is not an option for this Observing Program.
- The award for successfully completing the Spectroscopy Observing Program is a pin and a certificate.
Background Information
This certification is available to members of the Astronomical League, either through their local astronomical society or as members at large. If you are not a member and would like to become one, check with your local astronomical society, search for a local society on the Astronomical League Website (click here), or join as a Member-at-Large (click here).
To qualify for the AL’s Spectroscopy Observing Program certificate and pin, complete the required activities defined in the program.
Note: Remote telescopes may not be used in the Spectroscopy Observing Program. Remote Telescopes are defined on this Astronomical League web page: https://www.astroleague.org/terms-common-usage-observing.
Equipment Needed:To complete this Observing Program, you will need a spectroscope, camera, associated optics, mount, and drive. Special software will be needed to process the spectra. It may be possible to construct a DIY (do it yourself) working spectroscope. Commercial models range from about two hundred dollars to thousands of dollars. The Links section below contains links to DIY pages with possible solutions. A DSLR, CCD, or CMOS camera is needed to capture the spectra. Literature suggests a monochrome is preferred, but the color will be satisfactory for this program. If using a DSLR it is important to have one with an interchangeable lens system to maximize the size of the spectra. The optics you use will depend on the spectroscope and camera. Solutions will range from a moderate 200mm telephoto lens to a large telescope. A go-to tracking mount is suggested to make finding and imaging the stars easier. A variety of commercial and free software can be found on the Internet to analyze spectra. The Astronomical League makes no specific recommendations, but links can be found in the Links section below that lead to a number of helpful resources. Determining the Stellar Type:The stellar type of a star can be determined in two ways. This Observing Program will make use of the star’s spectra to calculate its surface temperature. Based on the spectrogram’s shape, prominent features, and surface temperature, the star’s stellar type will be determined. This method will be limited to class F, G, & K-type stars because the maximum wavelengths of other classes fall outside the visible range that can be detected by most cameras. Means to capture data in the UV and IR ranges exist but are beyond the scope of this Observing Program and the abilities of most amateur astronomers. |
|
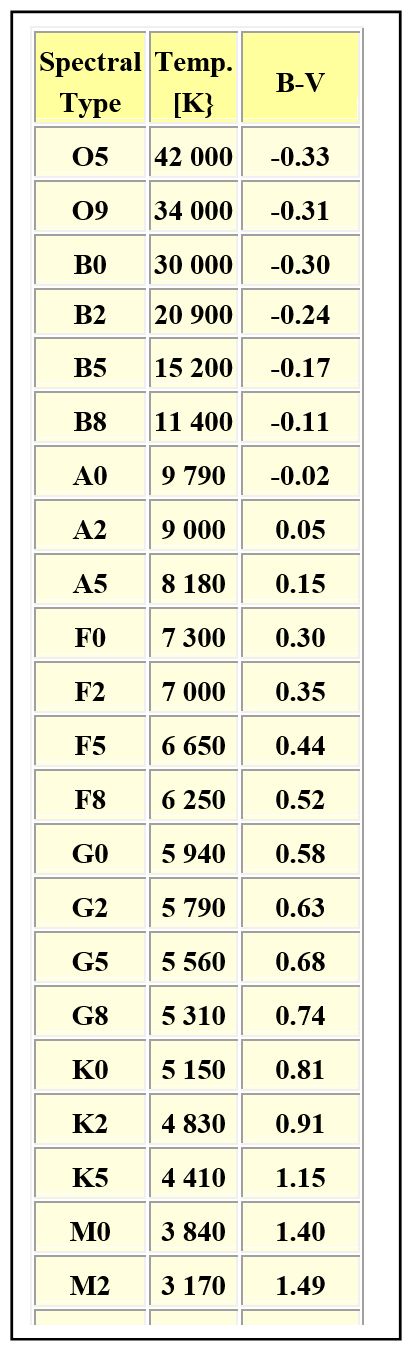
A second method performs photometry of images taken with photometric filters, usually B and V. The table below shows B – V values for various stellar classifications. While this method can be used to determine a wider range of classes, the cost of photometric B and V filters places this method beyond the scope of this program.
Note: The free program Stellarium when set to display all information displays B – V (color index) about the selected stars.
Requirements and Rules
This certification is available to members of the Astronomical League, either through their local astronomical society or as members at large. If you are not a member and would like to become one, check with your local astronomical society, search for a local society on the Astronomical League Website (click here), or join as a Member-At-Large in the AL Store.
Program Activities (Three Parts):
Part I: Characterizing Star Types
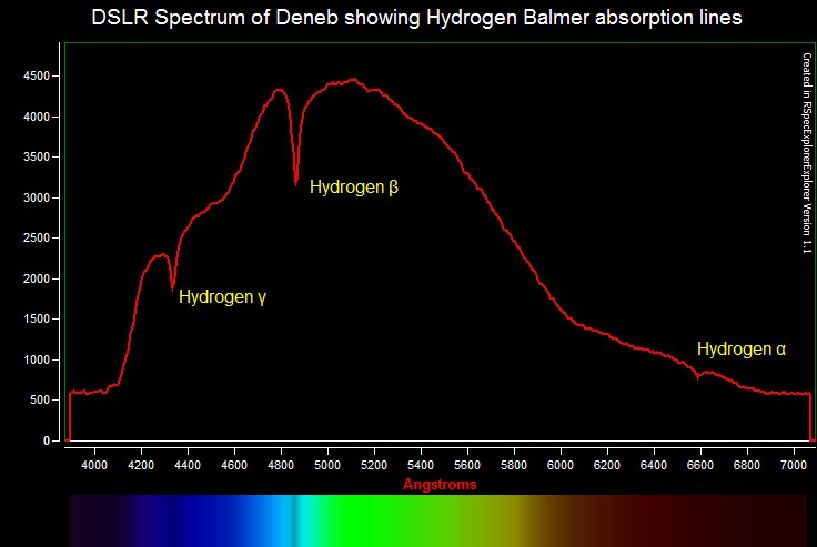
The stars you choose should come from the following Stellar Evolution groups: 3. For each of the spectra make a spectrogram. Label prominent lines and bands. For example:
|
 |
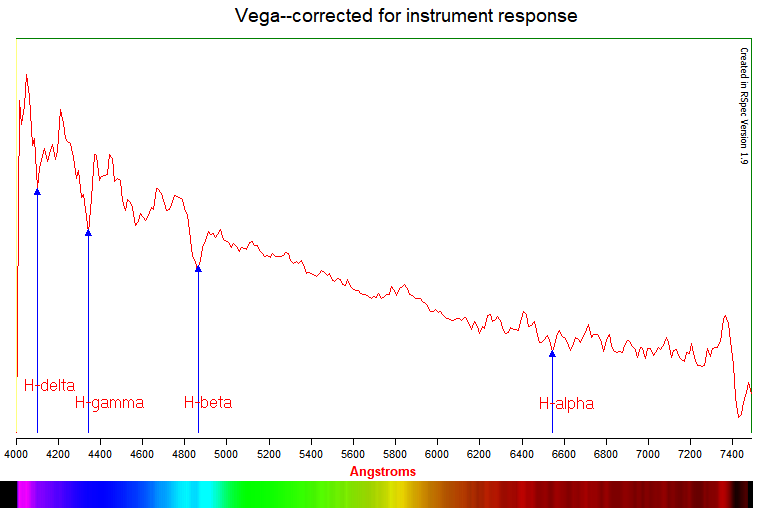
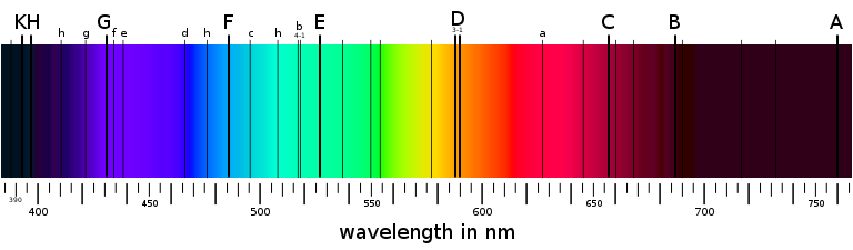
4. Making use of your spectrograms and the picture below attempt, to the best of your ability, to classify the stellar types (OBAFGKM).
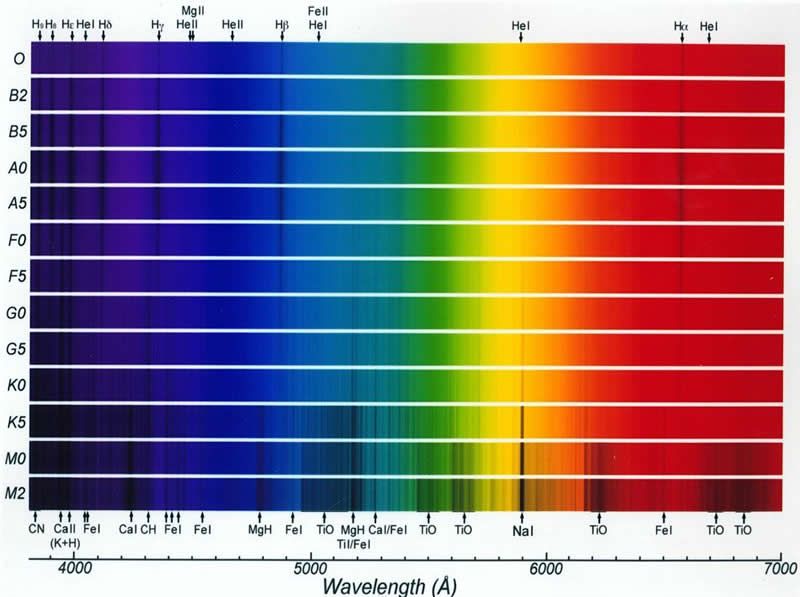
Note: O, B, A, & M stars are excluded here because the maximum wavelengths fall outside the visual and normal imaging sensor ranges.
https://sites.uni.edu/morgans/astro/course/Notes/section2/spectraltemps.html.
Note: Considerable variation in the data is found on the Internet. Your prediction should be considered approximate.
7. Omit the Sun from the following distance calculation.
Look up the apparent magnitude of your stars in the Stellar Evolution’s object list. Using the absolute magnitude for the star’s type, found in the Spectral Type Characteristics Table, calculate the distance the star is from the Earth by the spectroscopic parallax method.
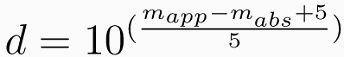
Note: There is considerable variation between internet sources for the data in the table below. Your results should be considered as an estimated distance to the stars.
You now have created the HR diagram for the stars you have studied.
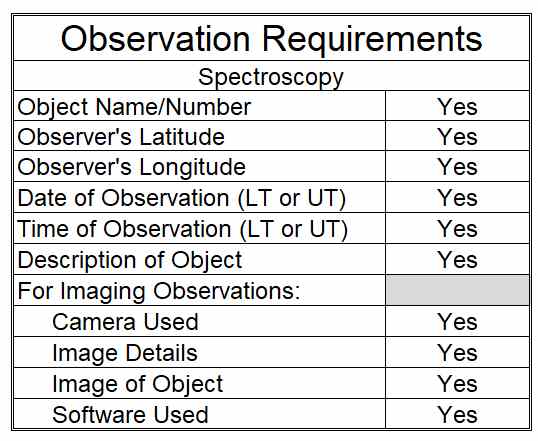
Required Information to be Submitted:
- Star Name
- Date and Time of the imaging (local or UT)
- Latitude and Longitude of your imaging location
- Seeing and Transparency
- Filters used (if any). Avoid filters that modify the spectrum, like a fringe-killer or a SemiAPO
- Telescope/optics used including aperture and focal ratio
- Camera/CCD/CMOS information including:
-
imaging software
- exposure times
- number of images
- other information relevant to the image production should also be provided
-
- Spectrum
- Spectrogram with prominent features labeled (significant lines, etc.)
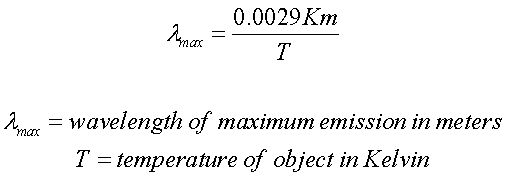
- Wavelength of maximum transmission
- Temperature of the star’s surface
- Estimated stellar type
- Distance to the star
- Graph of Absolute Magnitude (y) vs. Surface Temperature (x) for all stars measured
- Additional notes or observations related to the star. (This might include perceived visual color, imaging difficulty related to poor seeing, placement close to the horizon (airmass concerns), etc.)
Part II: Spectroscopic Binary Stars
Many double stars have separations that are much too small to see for even the best telescopes. We know they are doubles because their spectra change repeatably over time. Your task is to verify five spectroscopic eclipsing binary stars.
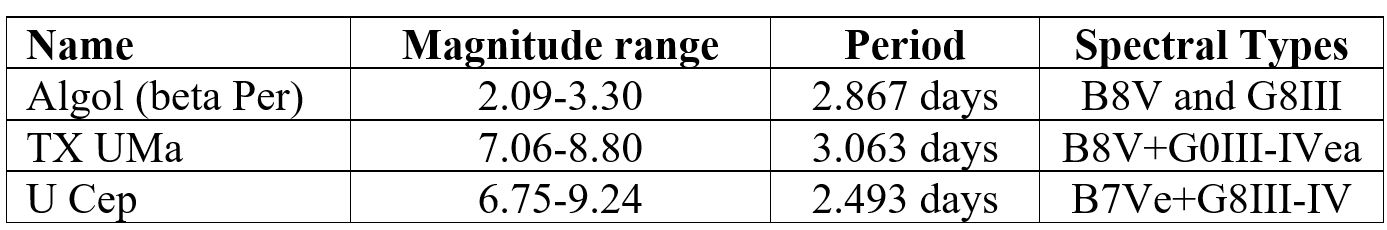
To help pick spectroscopic eclipsing binary stars to verify go to the “TIDAK – TIming DAtabase at Krakow“ website (http://www.as.up.krakow.pl/ephem/) and/or the “Ephemerides of Variable Stars” (http://www.motl.cz/dmotl/predpovedi/). You will use these databases to pick the stars you wish to verify because they will give you predictions of the best times for your observations. Select a constellation and look through the list noting the magnitudes and periods. Select eclipsing binaries that have magnitudes that are possible with your equipment based on your experience collecting data for the stars you choose in Part I. Eclipsing binaries with short periods can be done in one evening. Click an eclipsing binary and note that the new page gives a number of primary and secondary minima times for the next few days or weeks. A primary minimum is when the secondary star (the dimmer of the pair) blocks the light from the primary star ( the brighter of the pair). A secondary minimum is the opposite. You should image the eclipsing binary near these two times. If the primary and secondary stars are different stellar types, it may be possible to note a change in the spectra. By clicking on the Simbad link on the page it is possible to see the Spectral Type. Select your five eclipsing binary stars so they have different spectral types as far apart as possible. Since you won’t have to note the maximum wavelength any star type can be used. While not specifically required Algol (beta Per), TX UMa, and U Cep are good examples. Negative observations are permitted since this is dependent on the resolution of your spectrometer.
Additional information other than the minima times can be found in the AAVSO’s VSX (https://www.aavso.org/vsx/).
Imaging the star every few minutes for an hour on either side of the predicted minimum should give you enough data to ensure that you can tell that the eclipse actually happened.
For the five eclipsing binary stars report imaging data as above, the two spectra, the two spectrograms, and estimated stellar types for each member in the pair.
- Submit the above imaging data for the projects.
- Note: The ability to successfully complete some of the projects will depend on the resolution of your spectrograph.
Project 1: Spectra of Extended Deep Sky Objects
Capture and analyze the spectra of ten extended deep sky objects found within the Milky Way (planetary nebulae, open clusters, globular clusters, reflection and diffuse nebulae). Some types will give better results than others. Can you guess this in advance? Identify elements found in the spectra. Might your results suggest possible filters to aid in imaging these objects?
Project 2: Detect the Methane Atmosphere in Neptune and Uranus
Capture and analyze the spectra of Neptune and Uranus. Label the methane bands in their spectrograms.
Project 3 Spectra of Comets
Capture, analyze, and report any elements found in the spectra of two comets.
Project 4 Measure the redshift of galaxies
Capture and analyze the spectra of two galaxies. Galaxies with small, bright cores will work the best. Compare the spectra to an A-class star to see how much the Hydrogen-alpha line has been shifted in wavelength. From the shift calculate z describing the galaxy’s redshift.
Project 5 Spectra of RR Lyra type variable stars over a night
- Capture and analyze the spectra of RR Lyra or other RR Lyra-type variable star over the course of one night. Note any changes in the spectrum.
- Note: RR Lyra is the brightest and easiest of the type with a magnitude range of 7.17-8.14 over a 0.567-day period.
Project 6 User Submitted
- the change in spectra of a carbon star throughout its period
- a study of Wolf-Rayet stars
- the change in a supernova over time as it dims
- high-resolution solar spectrum showing Fraunhofer lines
- using spectra to differentiate between eclipsing binary stars and exoplanets
- solar spectra and the sun’s rotation
- explore stellar class classification by the B – V method outlined above
Submitting for Certification
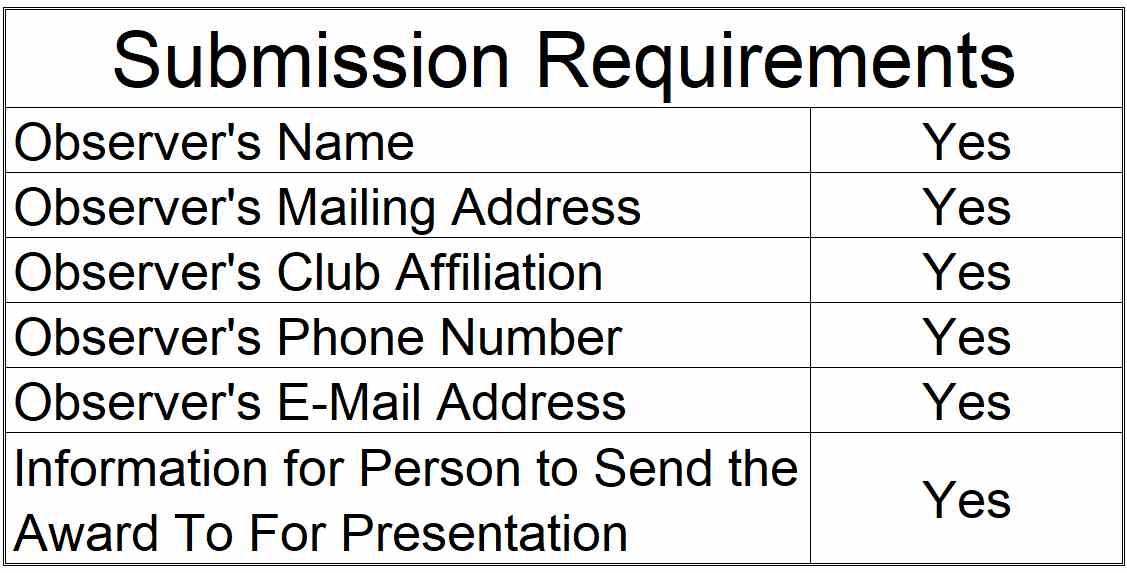
| To receive your certificate and/or pin, mail or email a copy of your observations to the Observing Program Coordinator. Include your name, mailing address, email address, phone number, and society affiliation. Indicate to whom the certification should be sent.
I prefer to verify the observations myself since I really love to see what other observers have done. However, if mailing the observations seems impractical and there is another member in your club who has already received the Spectroscopy Observing Program certification, I will accept an email recommendation from that person or your club’s Awards Coordinator after they have reviewed and approved your work. If there are any questions or problems, please contact the Coordinator. |
 |
Upon verification of your submission and of your active membership in the Astronomical League, your recognition (certificate, pin, etc.) will be sent to you or to the awards coordinator for your society, as you specified. Your name will also appear in an upcoming issue of the Reflector magazine and in the Astronomical League’s online database. Congratulations. Good luck with your next observing challenge.
Please send your submission to:
Spectroscopy Observing Program Coordinator:Steve Boerner |
Acknowledgements:
- Thanks to Mark Simonson of the Everett Astronomical Society and the Hydrogen Alpha Solar Observing Program Coordinator for his efforts in assisting the development of this Observing Program and for creating the design for both the Certificate and Pin.
Links:
- Astronomical League’s Stellar Evolution Observing Program: https://www.astroleague.org/stellar-evolution-observing-program
- Astronomical League’s Stellar Evolution Observing Program Object list: https://www.astroleague.org/stellar-evolution-observing-program
- ISIS (free) – http://www.astrosurf.com/buil/isis-software.html
- Rspec $ – https://www.rspec-astro.com
- V-Spec free – http://astrosurf.com/vdesnoux/
- and there are others…
- Find Your Observing Program Award
Additional Useful Links:
- Christian Buil’s page: http://www.astrosurf.com/buil/index.html
- David Haworth’s Observational Astronomy Spectroscopy Index: http://www.stargazing.net/david/spectroscopy/index.html
- Richard Walker’s page and online books:
- Spectral Types Characteristics Table: https://sites.uni.edu/morgans/astro/course/Notes/section2/spectraltemps.html
- Robin Leadbeater’s Three Hills Observatory’s spectrograph pages: http://www.threehillsobservatory.co.uk/astro/spectroscopy.htm
- CloudyNight Discussion about a DIY solution: https://www.cloudynights.com/topic/487663-how-to-make-your-own-star-analyser/