


\n”;
?>
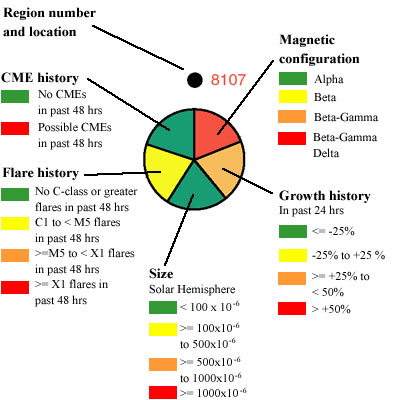
The solar map above shows the current active region numbers and locations assigned by the National Oceanic and Atmospheric Administration Space Weather Prediction Center. The colored circle below the active region indicates the activity level and hazard potential of an active region. See color coding used (below). If flares occur in the orange shaded area on the right side of the map, they are more likely to be directed towards Earth. Green marks at top of disk show current position angle or P-angle. P-angle is the tilt of the solar rotation axis to left and right in the plane of the sky. This may be used for orienting view with equatorial mount solar telescope.
The key code below was designed by the NASA Space Radiation Analysis Group to quickly identify hazardous active regions. (Note CME history indicator is not currently implemented).